MyWheelLife.com — May 27, 2026
I listened to 2 videos that made me want to write this
Every Bond Market In The World Is Breaking Andrei Jikh
Steve Keen: Marxism, Capitalism, and Economics | Lex Fridman Podcast #303
I’m putting a date on this so there’s no revisionism later. Today is May 27, 2026.
The US dollar is in structural decline, and I believe we are closer to a crisis point than most people want to admit. Let me walk through the numbers — the numbers tell this story better than any opinion does.
First, Some Distinctions That Matter
People use debt and deficit interchangeably. They’re not the same thing.
The deficit is the annual gap between what the government spends and what it collects in taxes. Right now that’s running at roughly $2 trillion per year.
The debt is the total accumulation of every prior year’s deficit, never paid off. As of today that number is approximately $39 trillion — up $10 trillion in just five years.
Most of that debt was financed the normal way: the Treasury sold bonds to real outside buyers — foreign governments, pension funds, insurance companies, individual investors. Those buyers handed over real existing dollars and received a Treasury bond in return. That’s genuine borrowing. It’s not money creation, it’s not inflationary on its own — it’s just the government living beyond its means and handing an IOU to whoever would take it.
Monetizing the debt is something different and more serious. That’s when the Federal Reserve itself buys Treasury bonds by creating new dollars that didn’t previously exist — typing numbers into a computer. No real buyer, no real savings transferred. Just new money conjured to cover government spending the market wouldn’t otherwise finance. The Fed currently holds about $4.5 trillion in Treasury securities, down from a peak of $5.7 trillion after COVID. That portion — roughly 10–15% of total debt — was genuinely monetized. New dollars created from nothing.
The rest is real debt owed to real creditors who expect to be paid back in dollars that are worth something.
A Ponzi Scheme With a Printing Press
Here’s the uncomfortable truth about how that debt gets serviced.
The US government cannot cover its obligations from tax revenue alone — that’s what the $2 trillion annual deficit means. So it pays existing obligations by borrowing from new creditors. Those new creditors will eventually need to be paid back — with money borrowed from still newer creditors. The debt never gets paid down. It only gets rolled over and expanded.
If that structure sounds familiar, it should. A classic Ponzi scheme works exactly the same way: you can’t generate enough real returns to pay existing investors, so you pay them with money coming in from new investors. It works as long as new money keeps flowing in. The moment inflows slow or confidence cracks, the structure collapses.
The difference between Bernie Madoff and the US Treasury is that Madoff couldn’t print money. The US can. That’s the escape valve that makes this particular Ponzi uniquely resilient — and uniquely dangerous. Instead of collapsing suddenly when new creditors dry up, the US can instruct the Federal Reserve to monetize — creating new dollars to pay old obligations. That keeps the scheme going longer but debases the currency in the process. Existing creditors get paid back in dollars worth less than the ones they lent.
That’s a soft default. Technically honoring the debt while quietly stealing the real value back through inflation. The default doesn’t show up in a missed payment. It shows up in your grocery bill.
The Structural Math
As of April 2026, the average blended interest rate on the total national debt is 3.37%. That sounds manageable until you do the math on $39 trillion — and until you understand that five years ago that blended rate was 1.49%. The debt didn’t change its nature. The cost of carrying it more than doubled.
Interest payments on the national debt will cross $1 trillion this fiscal year for the first time in history. To put that in perspective: interest on the debt is now larger than what we spend on Medicare. Larger than what we spend on national defense. It is the second largest expenditure of the federal government, trailing only Social Security.
The Math That Should Terrify You
The United States is the largest economy on Earth at roughly $32 trillion in annual output. But the government doesn’t collect GDP — it collects taxes. Federal tax revenue runs roughly $5.6 trillion per year. That is the actual pool of money the government has to work with.
Interest payments now consume $1 trillion of that — nearly 20 cents of every tax dollar — before the government funds a single program, pays a single soldier, or builds a single road.
The squeeze isn’t theoretical. It’s already happening in every budget negotiation, every spending cut, every unfunded priority. The interest bill is eating the government alive from the inside.
The Doom Loop in Plain Dollars
The math is simple. The government spends $7.5 trillion per year and collects $5.6 trillion in taxes. The roughly $2 trillion gap gets borrowed. That borrowing adds to the debt. A larger debt generates a larger interest bill next year. A larger interest bill widens the gap further. There is no mechanism in place to break this cycle. It is self-reinforcing by design.
And it is accelerating. Five years ago the blended interest rate on the debt was 1.49%. Today it is 3.37% — more than double. The debt itself grew by $10 trillion in that same period. The interest bill has nearly tripled in five years, from around $345 billion in 2020 to over $1 trillion today.
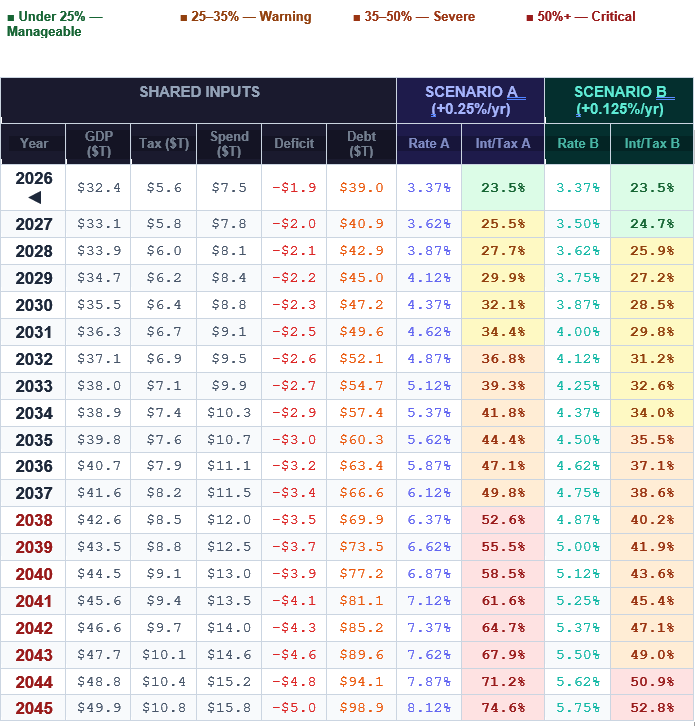
The Doom Loop: 20-Year Projection (2026–2045)
The table below models two scenarios for how the blended interest rate on US debt evolves over the next 20 years. Scenario A assumes the rate rises 0.25% per year — gradual but relentless, reflecting ongoing refinancing at elevated market rates. Scenario B assumes a slower 0.125% annual rise. The highlighted Int/Tax columns show interest payments as a percentage of annual tax revenue — the most direct measure of fiscal pressure. Color coding: green = manageable, yellow = warning, orange = severe, red = critical.
The problem is both of these scenarios might not be agressive enough! While the Fed and Trump want to lower rates, the market is demaning higher rates NOW!
| ■ Under 25% — Manageable | ■ 25–35% — Warning | ■ 35–50% — Severe | ■ 50%+ — Critical |
| SHARED INPUTS | SCENARIO A (+0.25%/yr) | SCENARIO B (+0.125%/yr) | |||||||
| Year | GDP ($T) | Tax ($T) | Spend ($T) | Deficit | Debt ($T) | Rate A | Int/Tax A | Rate B | Int/Tax B |
| 2026 ◀ | $32.4 | $5.6 | $7.5 | -$1.9 | $39.0 | 3.37% | 23.5% | 3.37% | 23.5% |
| 2027 | $33.1 | $5.8 | $7.8 | -$2.0 | $40.9 | 3.62% | 25.5% | 3.50% | 24.7% |
| 2028 | $33.9 | $6.0 | $8.1 | -$2.1 | $42.9 | 3.87% | 27.7% | 3.62% | 25.9% |
| 2029 | $34.7 | $6.2 | $8.4 | -$2.2 | $45.0 | 4.12% | 29.9% | 3.75% | 27.2% |
| 2030 | $35.5 | $6.4 | $8.8 | -$2.3 | $47.2 | 4.37% | 32.1% | 3.87% | 28.5% |
| 2031 | $36.3 | $6.7 | $9.1 | -$2.5 | $49.6 | 4.62% | 34.4% | 4.00% | 29.8% |
| 2032 | $37.1 | $6.9 | $9.5 | -$2.6 | $52.1 | 4.87% | 36.8% | 4.12% | 31.2% |
| 2033 | $38.0 | $7.1 | $9.9 | -$2.7 | $54.7 | 5.12% | 39.3% | 4.25% | 32.6% |
| 2034 | $38.9 | $7.4 | $10.3 | -$2.9 | $57.4 | 5.37% | 41.8% | 4.37% | 34.0% |
| 2035 | $39.8 | $7.6 | $10.7 | -$3.0 | $60.3 | 5.62% | 44.4% | 4.50% | 35.5% |
| 2036 | $40.7 | $7.9 | $11.1 | -$3.2 | $63.4 | 5.87% | 47.1% | 4.62% | 37.1% |
| 2037 | $41.6 | $8.2 | $11.5 | -$3.4 | $66.6 | 6.12% | 49.8% | 4.75% | 38.6% |
| 2038 | $42.6 | $8.5 | $12.0 | -$3.5 | $69.9 | 6.37% | 52.6% | 4.87% | 40.2% |
| 2039 | $43.5 | $8.8 | $12.5 | -$3.7 | $73.5 | 6.62% | 55.5% | 5.00% | 41.9% |
| 2040 | $44.5 | $9.1 | $13.0 | -$3.9 | $77.2 | 6.87% | 58.5% | 5.12% | 43.6% |
| 2041 | $45.6 | $9.4 | $13.5 | -$4.1 | $81.1 | 7.12% | 61.6% | 5.25% | 45.4% |
| 2042 | $46.6 | $9.7 | $14.0 | -$4.3 | $85.2 | 7.37% | 64.7% | 5.37% | 47.1% |
| 2043 | $47.7 | $10.1 | $14.6 | -$4.6 | $89.6 | 7.62% | 67.9% | 5.50% | 49.0% |
| 2044 | $48.8 | $10.4 | $15.2 | -$4.8 | $94.1 | 7.87% | 71.2% | 5.62% | 50.9% |
| 2045 | $49.9 | $10.8 | $15.8 | -$5.0 | $98.9 | 8.12% | 74.6% | 5.75% | 52.8% |
ASSUMPTIONS & METHODOLOGY
| Base debt (2026) | $39T | GDP growth | 2.3%/year |
| Base tax revenue | $5.6T | Tax revenue growth | 3.5%/year |
| Base spending | $7.5T | Spending growth | 4.0%/year |
| Base blended rate | 3.37% | Interest calc | Total debt × blended rate |
| Scenario A rate rise | +0.25%/year | Deficit | Spending minus tax revenue |
| Scenario B rate rise | +0.125%/year | Note | No Fed intervention modeled |
MyWheelLife.com · For informational purposes only · Not financial advice
The Refinancing Wall Hitting Right Now
Here’s what this looks like in the immediate term. The US has approximately $9 trillion in debt maturing in 2026 alone — nearly a quarter of the entire national debt rolling over and needing to be refinanced at whatever rate the market demands today. Another $6 trillion matures by 2028. That’s $15 trillion refinanced in three years.
Today’s blended rate on the total debt is 3.37%. If that refinancing happens at 5% instead — which is not a crisis rate; the 30-year Treasury recently touched 5.2% — the additional interest cost on just the 2026 tranche alone is roughly $150 billion extra per year, every year going forward. By 2028, having refinanced the bulk of short-term debt at elevated rates, you’re looking at $1.3 to $1.5 trillion in annual interest — against roughly $5.6 trillion in tax revenue. That’s 25–27 cents of every tax dollar going to interest before the government does anything else.
This isn’t a projection of what might happen in some distant future. The refinancing is happening right now. The bills are coming due this year.
How the Loop Kills You
When investors begin to doubt your ability to service debt, they demand higher rates to compensate for the risk. Higher rates make the interest bill larger. A larger interest bill widens the deficit. A wider deficit means more borrowing. More borrowing at higher rates means investors demand still higher rates. The debt grows faster. The cycle accelerates.
This is the same mechanism that destroyed Greece, Argentina, and Turkey. The only thing protecting the US from this dynamic is that the dollar is the world’s reserve currency — meaning global demand for dollars is structurally baked in regardless of US fiscal behavior. Oil is priced in dollars. Global trade is settled in dollars. Foreign central banks hold dollars as reserves. This creates a captive buyer for US debt that no other country enjoys.
That protection is real. It is also eroding.
The Buyers Are Leaving
Two of America’s biggest foreign lenders are actively pulling back. China, which once held $1.3 trillion in US Treasuries, is now down to around $650 billion — a 17-year trend that is accelerating. Every bond China sells means one fewer buyer in the market, which means the US has to pay more to find a replacement.
Japan, the largest foreign holder at around $1.1 trillion, is being forced to sell for a different reason: it needs dollars to defend the yen and to buy oil. In Q1 2026 alone, Japan sold more US Treasuries than in the prior four years combined. The mechanism is vicious — selling Treasuries pushes US yields higher, a stronger dollar makes the yen weaker, which forces Japan to sell even more Treasuries to defend it. It’s a doom loop within the doom loop.
Beyond China and Japan, Taiwan, Saudi Arabia, India, the UAE, Norway, and Singapore have all been reducing exposure. BRICS nations are actively building alternative settlement systems. The petrodollar arrangement that anchored dollar demand for fifty years is quietly unwinding — Saudi Arabia is now accepting payment for oil in other currencies. None of these individually are fatal. Together they represent a slow withdrawal of the structural demand that has allowed the US to run deficits that would have collapsed any other currency already.
The Trap
The Federal Reserve is sitting with an impossible choice.
If it cuts rates: bond investors, already nervous about inflation running at 3.8% with PPI at 6%, interpret the cut as the Fed prioritizing the economy over their purchasing power. They sell. Yields go up anyway. The thing the cut was supposed to prevent happens regardless.
If it raises rates: the interest bill on $39 trillion in debt gets larger immediately. Credit card delinquencies are already above 12%. Auto loan defaults are rising. Housing has significantly slowed. A rate increase into that environment risks breaking the economy.
Making this worse: the Fed under Kevin Worsh is reportedly moving away from standard core PCE inflation measurement toward something called trimmed mean PCE — which strips out extreme price movements. Convenient timing, given oil is up 60% since the Iran war started. On paper it produces a lower inflation reading, which might justify not raising rates. Draw your own conclusions about what that means for the integrity of the data.
When Does Monetization Become Forced?
Right now the annual deficit is being financed mostly through real bond sales to real buyers. But the math eventually forces the Fed’s hand. If private buyers demand rates that make the deficit spiral unmanageable, the choice becomes: let rates spike to crisis levels, or have the Fed step in and monetize — creating new dollars to buy bonds the market won’t absorb at acceptable rates.
At that point inflation becomes structural, not episodic. The dollar’s real value gets eroded not through a single dramatic event but through a slow, sustained expansion of the money supply to cover obligations that can’t otherwise be met.
We have been here before. In 1970, the US faced the same impossible math — couldn’t raise taxes, couldn’t cut benefits. So the government chose the invisible option: inflation. The purchasing power of the US dollar dropped roughly 50% from 1970 to 1980. Half of the dollar’s value, gone in ten years. During that same decade, gold went from $35 an ounce to $850 an ounce. Bond investors who lived through that decade know exactly what this setup looks like.
The most likely path today isn’t a dramatic overnight collapse. It’s a slow bleed — inflation running persistently above what the Fed officially targets, the real value of dollar-denominated savings quietly destroyed over years, purchasing power hollowed out while nominal numbers keep going up.
Where I’m Putting My Money
I hold Bitcoin in part because of this analysis. A fixed-supply asset that exists outside any government’s balance sheet is a rational place to be when the world’s reserve currency is structurally compromised. You can’t run a Ponzi scheme on a 21 million coin limit. The math doesn’t care about politics.
And the demand signal is becoming concrete, not theoretical: Iran is now demanding Bitcoin as payment for oil. That’s a sovereign nation — one of the world’s major oil exporters — actively routing around the dollar system in real transactions. That’s not a fringe argument about crypto. That’s the petrodollar arrangement breaking down in real time.
Central banks around the world bought over a thousand tons of gold in 2024 alone — choosing gold over Treasury bonds. Banks that are not sensitive to interest rates the way ordinary investors are, and that generally know things ahead of time, are making a geopolitical diversification bet. That tells you something.
I could be early. The dollar has muddled through versions of this argument for decades. But muddling through and being structurally sound are not the same thing. At some point the compounding wins.
I’m writing this down today so the record exists. Written May 27, 2026. Published at MyWheelLife.com.