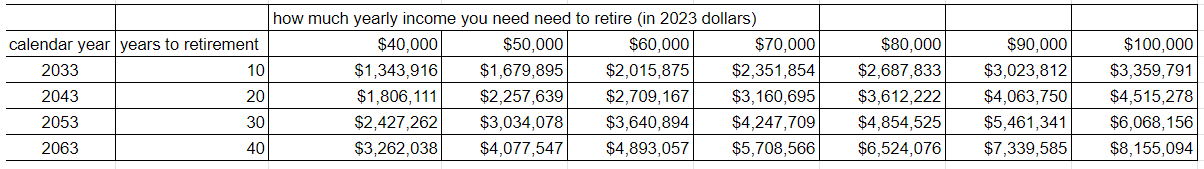
For years, the standard framework for retirement income has been the 4% rule.
The idea is simple: if you want $48,500 per year of spending, you would typically need roughly:
$48,500 × 25 = $1,212,500
In other words, about $1.2 million invested in a diversified portfolio to sustainably withdraw that income.
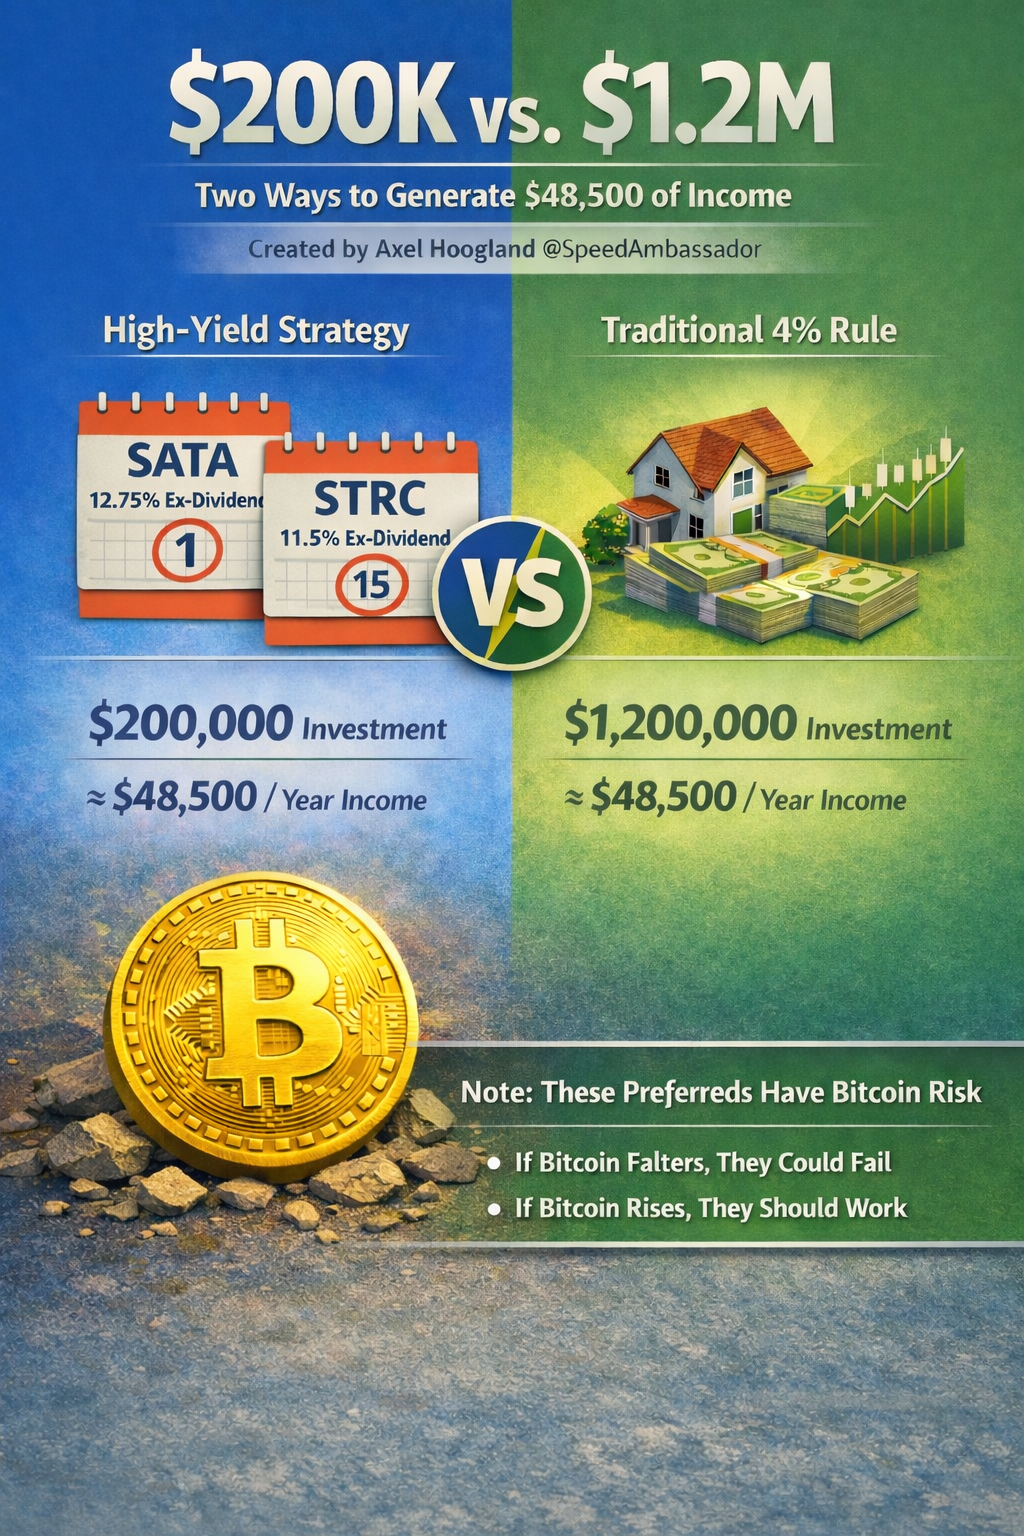
But recently I came across an interesting thought experiment involving two relatively new preferred securities.
Before diving into the math, it’s important to note that these securities ultimately sit within financial structures connected to Bitcoin, so they carry some exposure to the long-term success of Bitcoin itself. More on that later.
Two High-Yield Preferred Securities
Two securities caught my attention:
- Strategy Series C Preferred (STRC) – currently yielding about 11.5%
- Strive Asset Management Preferred (SATA) – currently yielding about 12.75%
Both are preferred securities issued by companies building financial products around Bitcoin treasury strategies.
An interesting feature is their dividend timing.
- STRC has an ex-dividend date around the 15th of the month
- SATA has an ex-dividend date around the 28th of the month
The actual cash payment arrives roughly 15 days later, but what matters for dividend eligibility is simply holding the shares on the ex-dividend date.
After that date passes, an investor can sell the shares and still receive the dividend.
The Rotation Idea
Because the ex-dividend dates occur at different times of the month, a strategy some investors discuss is rotating between the two securities:
- Hold STRC through its ex-dividend date (~15th)
- After the ex-date passes, sell and move into SATA
- Hold SATA through its ex-dividend date (~28th)
- Then rotate back to STRC and repeat
In theory, this rotation attempts to capture both dividend streams each month.
The Yield Math
Using approximate yields:
SATA: 12.75%
STRC: 11.5%
Combined:
12.75% + 11.5% = 24.25%
If an investor pays roughly 24% tax on the income:
24.25% × 0.76 ≈ 18.4% after tax
That’d give this investor $18,400 per a year income on $100k or $36,400 per a year on $200k.
The Early Retirement Thought Experiment
Suppose an early retired investor allocated $200,000 to this strategy.
At a 24.25% gross yield, the income would be:
$200,000 × 0.2425 = $48,500 per year
Under the traditional 4% rule, producing that same income would require:
$48,500 × 25 = $1,212,500
So the comparison looks like this:
| Strategy | Capital Required |
|---|---|
| Traditional 4% rule | ~$1.2 million |
| Preferred rotation idea | ~$200,000 |
That’s roughly a 6× difference in required capital.
Even More Interesting for Early Retirees
For some early retirees who structure their income carefully, qualified dividend income can fall within the 0% federal tax bracket.
In that scenario, the full 24.25% yield could theoretically flow through without federal income tax.
Using the same $200,000 example:
| Investment | Yield | Annual Income |
|---|---|---|
| $200,000 | 24.25% | $48,500 |
That level of income could cover a meaningful portion of living expenses for many households.
The Bitcoin Connection
It’s important to understand what ultimately sits underneath these securities.
Both STRC and SATA are part of financial structures built around companies holding significant amounts of Bitcoin on their balance sheets.
At the base of these preferred securities is therefore some degree of Bitcoin risk.
If Bitcoin were to fail as an asset class entirely, the underlying business models supporting these preferreds would likely fail as well.
However, if Bitcoin continues to grow and remain valuable over time, these structures should continue to function as designed.
It is also possible that as demand for these types of securities increases, the dividend yields could gradually decline. Markets tend to compress yields when large numbers of investors compete for the same income-producing assets.
So the yields discussed above should be viewed as the current state of the market, not necessarily a permanent condition.
Finally there is company risk. Strive (ASST) issues SATA and Strategy (MSTR) issues STRC. Either company could fail for some generic business reason and that woudl also be a risk, just like any business.
Final Thoughts
For decades, the 4% rule has been a useful guideline for thinking about retirement income.
But financial markets are constantly evolving, and new structures occasionally appear that change the math in interesting ways.
This rotation idea may or may not prove durable over the long run. But it highlights how emerging financial instruments—especially those tied to Bitcoin treasury strategies—are beginning to create entirely new types of income assets.
And sometimes, when you run the numbers, it’s worth pausing and asking:
Could the future of income investing look different than the past?
As of 3-16-2026 I started an account to do this specifically. I will share the results in a few months or at the end of the year to see how it’s gone and if anything has changed since I started this experiment.
All prices in the below table are per share. multiple the # shares x any price to get the total amount. I started with 10x $97.22 = $972.20 and a purchase of 10 shares of SATA.
| Stock | # shares | Date Purchased | Date Sold | Purchase Price | Sell Price | price appreciation | Dividend Date | Dividend |
| SATA | 10 | 3-16-26 | 4-1-26 | $97.22 | 97.89 | +$0.67 | ||
This article is for informational purposes only and should not be considered investment advice.