Data gathered from this link – https://taxfoundation.org/data/all/federal/latest-federal-income-tax-data-2025/
When we talk about taxes in America, the debate often gets sloppy. People use “income” and “wealth” almost interchangeably, but they’re very different things.
- Income is the flow of money earned each year — wages from a job, dividends, or realized capital gains.
- Wealth is the stock of assets someone already owns — businesses, real estate, stocks, Bitcoin, etc.
Our tax system is built mainly on income, not wealth. And when commentators conflate the two, it clouds the conversation about fairness and policy.
Income Snapshot
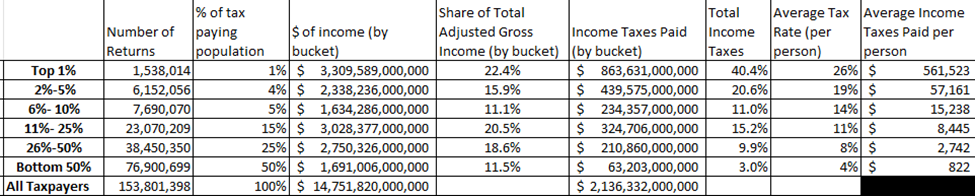
In 2022, the U.S. collected $2.1 trillion in federal income taxes on about $14.8 trillion in total income. That’s about 14.4% of taxable income.
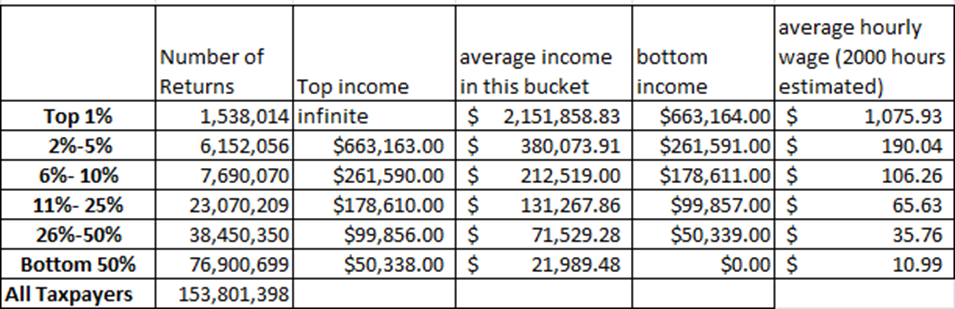
Divide that income across all 153 million taxpayers, and the average income comes out to $95,915, or about $47.96 per hour assuming 2,000 hours of work per year. Of course, averages can mislead — the distribution is anything but equal.
The Top 1%
To qualify for the top 1% in 2022, you needed at least $663,164 of income. On average, these 1.5 million taxpayers earned $2.1 million each.
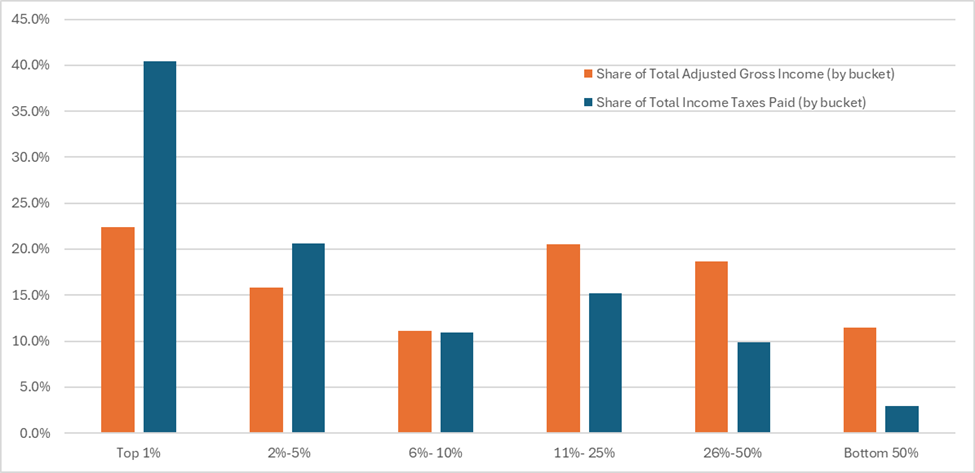
- Share of income: 22.4%
- Share of taxes paid: 40.4%
- Effective tax rate: 26%
The Bottom 50%
The bottom half — about 76 million taxpayers — earned less than $50,339 per year. Their average income was just $21,000, totaling $1.7 trillion across the group.
- Effective tax rate: ~4%
- Many pay no federal income tax at all, often due to credits like the Earned Income Tax Credit (EITC) or child tax credits.

Wealth Snapshot
If we shift from income to wealth, the picture looks even starker. As of mid-2025, U.S. billionaires hold over $6.2 trillion in wealth, spread across only about 813–867 individuals.
But here’s the catch: the U.S. government is adding about $2 trillion in deficit spending every year. Even if you taxed billionaires at extremely high rates, it might cover only a year or two of deficits. After that, the wealth pool would shrink — and most billionaires would likely relocate to avoid such aggressive taxation.
That doesn’t mean we shouldn’t debate fairness, redistribution, or even wealth taxes. But it does mean we need to be realistic about the math.
Why This Matters
The key takeaway is that income and wealth are different conversations. Most tax debates focus on income flows, yet the loudest arguments are often about wealth concentration. If we mix those together, we miss the real tradeoffs.
I’m happy to debate how much each group should earn, or whether a wealth tax makes sense (though I personally think it doesn’t). But if we want an honest conversation, we have to separate what we’re actually measuring.
Because when we ask, “Who should pay more?” the first step is being clear: are we talking about annual income, or about the stock of wealth built up over decades?
Data – https://taxfoundation.org/data/all/federal/latest-federal-income-tax-data-2025/
You will notice myd ata is slightly different than from the website. The website continually aggregates so their “top 5%” data includes all the income & people from the top 1% + the 2%-5%.
I have broken it down so you can see how much income is in each bucket. I think my method is much more useful.
It also allows you to see how much income, taxes, average income, is in each bucket.
When the data is aggregated it always is skewed due to the higher amount of income above it.